Podcast · Systematic Investing
Episode 1: Where liquidity goes in a stressed market
Our head of liquidity research explains why market depth vanishes in a sell-off, what it costs systematic strategies, and how to size trades for stress.

Audio available to subscribers in the Investor Portal. Clients can listen to the full episode after signing in to the Investor Portal. An edited transcript excerpt appears below.
Episode summary
Liquidity looks plentiful on a calm day and disappears on the day it is needed. In this episode, a member of our Risk team speaks with the head of liquidity research in our Quantitative Trading group, about what actually happens to market depth during a sell-off, why systematic strategies can make it worse, and how we plan position sizes and trading schedules around stress rather than around average conditions.
Key takeaways
- Liquidity has three dimensions: the cost to trade, the size available at that cost, and how quickly prices recover after a trade. Stress hits all three at once.
- On a stress day, the quantity available near the best price can fall by more than half while spreads triple, so trading costs rise much faster than spreads alone suggest.
- We size positions using a stressed estimate of liquidity, and we plan how many days an exit would take before a position is opened.
Chapters
- Introduction
- What we mean by liquidity
- Anatomy of a stress day
- What it costs a systematic strategy
- Sizing and planning for stress
- Questions investors should ask
The episode in one chart
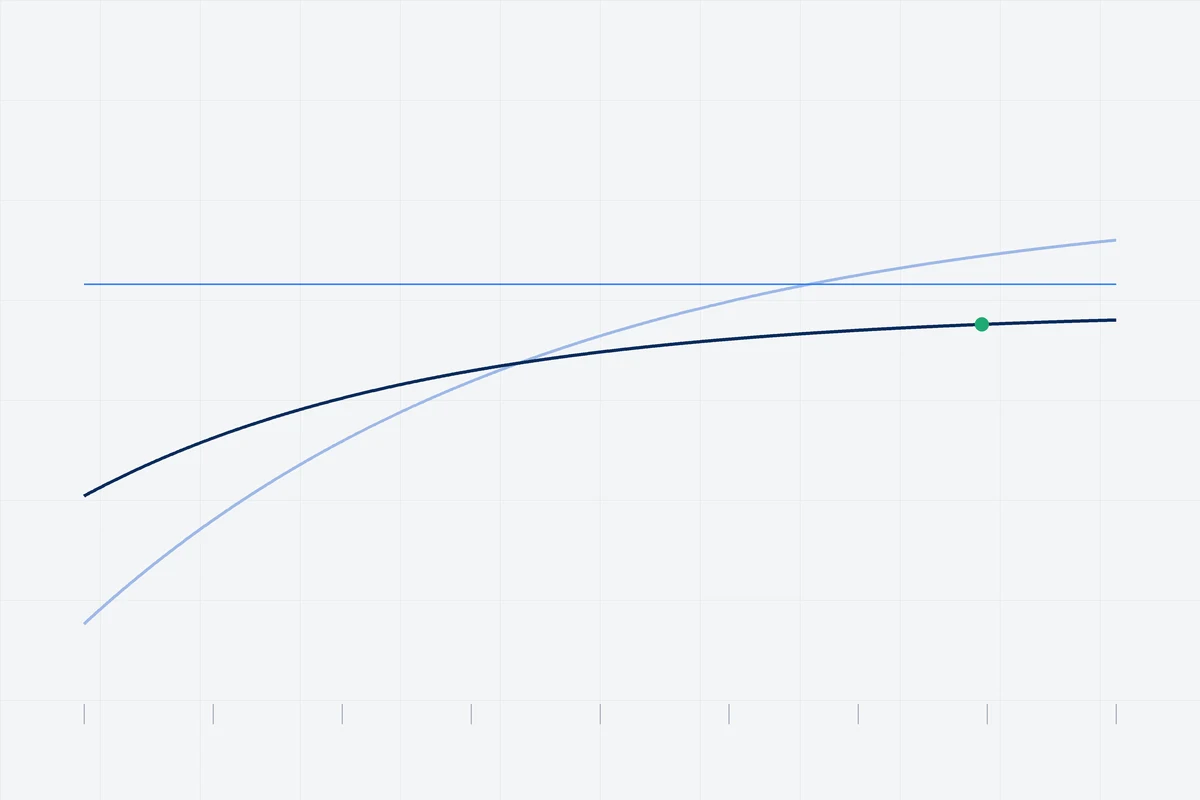
The guest describes a typical pattern around a stress event in a liquid futures market. Both measures below are indexed so that a normal day equals 100.
Transcript excerpt
00:00 Introduction
Host: Welcome back. Today we are talking about the thing every trader assumes is there until it isn’t: liquidity. My guest runs liquidity research for our Quantitative Trading group in Chicago. Thanks for joining.
Guest: Thanks for having me. It’s a topic people only want to discuss after a bad week, so I’m glad we’re doing it on a quiet one.
03:10 What we mean by liquidity
Host: Let’s start with a definition. When you say a market is liquid, what are you measuring?
Guest: Three things. First, the cost of a small trade, which is roughly half the bid-ask spread. Second, depth: how much you can trade before the price moves against you. Third, resilience: how quickly prices and quotes come back after a large trade. Most people look only at the first one because it’s on the screen. The other two are where the risk is.
08:45 Anatomy of a stress day
Host: Walk us through what happens on a stress day.
Guest: Market makers hold inventory, and on a volatile day the risk of holding it goes up. So they do two things: they quote wider, and they quote smaller. The spread you see might triple. But the quantity available at that spread can fall by two-thirds. If you need to trade size, you are walking through several price levels, and your real cost is far higher than the quoted spread.
Host: And resilience?
Guest: That’s the slow part. After a large trade on a normal day, the order book refills in seconds. On a stress day it can take minutes, and the next seller arrives before it has refilled. Liquidity becomes a crowded exit.
15:20 What it costs a systematic strategy
Host: Systematic strategies are often blamed for making this worse. Is that fair?
Guest: Partly. Many systematic programs scale positions to volatility. When volatility jumps, they all cut risk, and they do it in the same markets on the same days. A model that looked cheap to run on average conditions can be expensive to run in exactly the weeks it trades most. That’s why we estimate costs for stressed conditions, not average ones, before a strategy goes live.
21:05 Sizing and planning for stress
Host: So what do you do differently?
Guest: Two things. We size each position so it could be exited within a set number of days using a stressed estimate of daily volume, typically a fraction of what the market trades on a bad day, not a good one. And we spread risk reductions over time rather than trading everything at the open. Paying a bit more tracking error to trade over three days is usually cheaper than trading in the first hour after a shock. Our independent risk management team sets those exit limits, not the portfolio managers.
25:40 Questions investors should ask
Host: Last question. If you were an investor evaluating any manager, what would you ask about liquidity?
Guest: Ask how many days it would take to exit the portfolio in a stressed market, and how that estimate was built. Ask whether trading-cost estimates come from average days or bad ones. And ask to see what the manager actually paid in the last volatile month, compared with what the model expected. A manager who can answer all three has thought about it.
Host: Thank you. For more on how we supply liquidity rather than consume it, see our Liquidity Provision page.
This transcript has been edited for length and clarity. The views expressed are those of the speakers as of the recording date, are subject to change, and are provided for informational purposes only. They are not investment advice or a recommendation to buy or sell any security. Examples and figures are hypothetical. Investing involves risk, including possible loss of principal.